Microsoft Excel is one of Microsoft’s best productivity tools in the Microsoft Office suite. Excel can help you achieve a lot both on individual and business levels for financial functions. One of the things that Excel can do is help you calculate the return period of an investment using the NPER function.

In this article, you'll learn the formula syntax and usage of the NPER function in Microsoft Excel.
Description of the NPER Function in Excel
The NPER is a built-in financial function in Excel and stands for the Number of Payment periods (NPER) for a loan taken. The NPER function in Excel helps calculate the number of periods for an investment (loan) based on the periodic, constant payment schedule, and a constant interest rate.
Note: the purpose of NPER is to calculate the number of periods for a loan or an investment.
Points to note about NPER Function in Excel
- NPER is a built-in Excel function
- NPER stands for “Number of Periods.” The number of periods required to clear the loan amount at the specified interest rate and specified monthly EMI amount.
- The NPER formula is available under the Financial function and Formula tab.
- Using NPER Function Excel, you can adjust the loan amount based on your savings to clear the EMI amount.
NPER Applies To
NPER is available on Excel for Office 365, Excel 2019, Excel 2016, Excel 2013, Excel 2011 for Mac, Excel 2010, Excel 2007, Excel 2003, Excel XP, Excel 2000
NPER Syntax (NPER Formula Excel)
The syntax (formula) for the NPER function in Microsoft Excel is:
=NPER (rate, pmt, pv, [fv], [type])

Arguments/Parameters
Here are the arguments or parameters for the NPER function syntax in Excel. NPER arguments are required or optional.
- Rate (required argument): the investment/loan’s interest rate per period
- Pmt (required argument): The amount of payment made for each period. Generally, it contains principal and interest but no other fees and taxes. It cannot change over the life of the annuity.
- Pv (required argument): The present value of the payments, or the lump-sum amount that a series of future payments is worth right now. Its the loan amount.
- Fv (optional argument): stands for future value. It is the future value of the loan amount or a cash balance you want to attain after the last payment is made. If fv is omitted, Excel automatically assumes that it is 0 (the future value of a loan; for example, is 0).
- Type (optional argument): indicates when the payments are due denoted by 0 or 1; where 0 (default) denotes that payments are due at the end of the period and 1 denotes that payments are due at the beginning of the period.
Returns
The NPER function returns a numeric value often the number of periods.
Types of NPER Function
NPER can be used in Excel as a:
- Worksheet function (WS): entered as part of a formula in a cell of a worksheet
- Visual Basic Editor VBA function: use NPER in macro code that is entered through the Microsoft Visual Basic Editor.
How to Use NPER Function in Excel
The best way to demonstrate how to use NPER function in Excel is through practical examples. Follow this article to look at the live scenarios of using NPER in excel.
Example #1 - Loan
Case
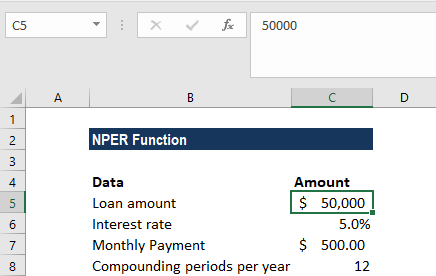
Assuming Sam needs $50,000 for his loan investment. He will get a loan at a 5% interest rate, with a $500 monthly payment. Calculate the number of periods required to repay the loan.
Solution
Visual Case representation
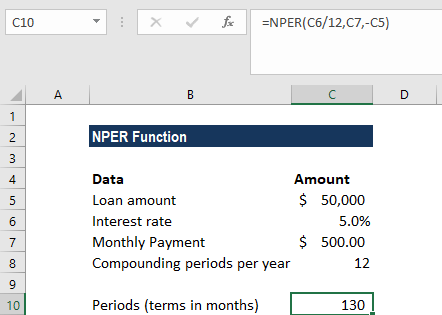
Apply NPER Formula

Display NPER Solution (results)
Solution Notes:
In this example:
- We’ve input the loan payment as a negative value because it represents an outgoing payment.
- The loan payments are made monthly. So, it’s important to convert the annual interest rate of 5% into a monthly rate (=5%/12).
- We projected the future value (fv) as 0, and that the payment is to be made at the end of the month. Hence, the [fv] and [type] arguments are omitted from the function call.
- The returned value is in months. We then rounded the result to the nearest whole month, it comes to 130 months [10 years, 10 months].
Examples #2 - Investment
Case
Bradley wishes to make an investment of $10,000 and to earn $500,000. The annual interest rate is 5%. He will make additional monthly contributions of $5,000. Calculate the number of monthly investments required to earn $500,000.
Solution
Visual Excel representation of the case

Apply NPER Formula

Display results

Notes
- The number of monthly investments required to earn $500,000 in 85 months (7.12 years)
Notes to remember about the NPER Function:
- In line with the cash flow convention, outgoing payments are represented by negative numbers and incoming cash flows by positive numbers.
- #NUM! error – This occurs if the stated future value will never be met or the supplied periodic interest rate and payments are insufficient. In such a scenario, you can increase the payment amount or increase the interest rate to achieve a valid result.
- #VALUE! error – this occurs if any of the given arguments are non-numeric values.
Wrapping Up
We hope that this guide was able to show you how to use the NPER Excel function. Excel has many functions and this is just one of them.
If you’re looking for more guides or want to read more Excel, and tech-related articles, consider subscribing to our newsletter where we regularly publish tutorials, news articles, and guides.
Recommended Reads